Transforming a Critical B2B
Data Governance Platform
Schneider Electric
Schneider Electric's global offer publication system was at risk due to legacy architecture and stakeholder misalignment.
We redesigned the governance model to restore scalability and reliability.
-
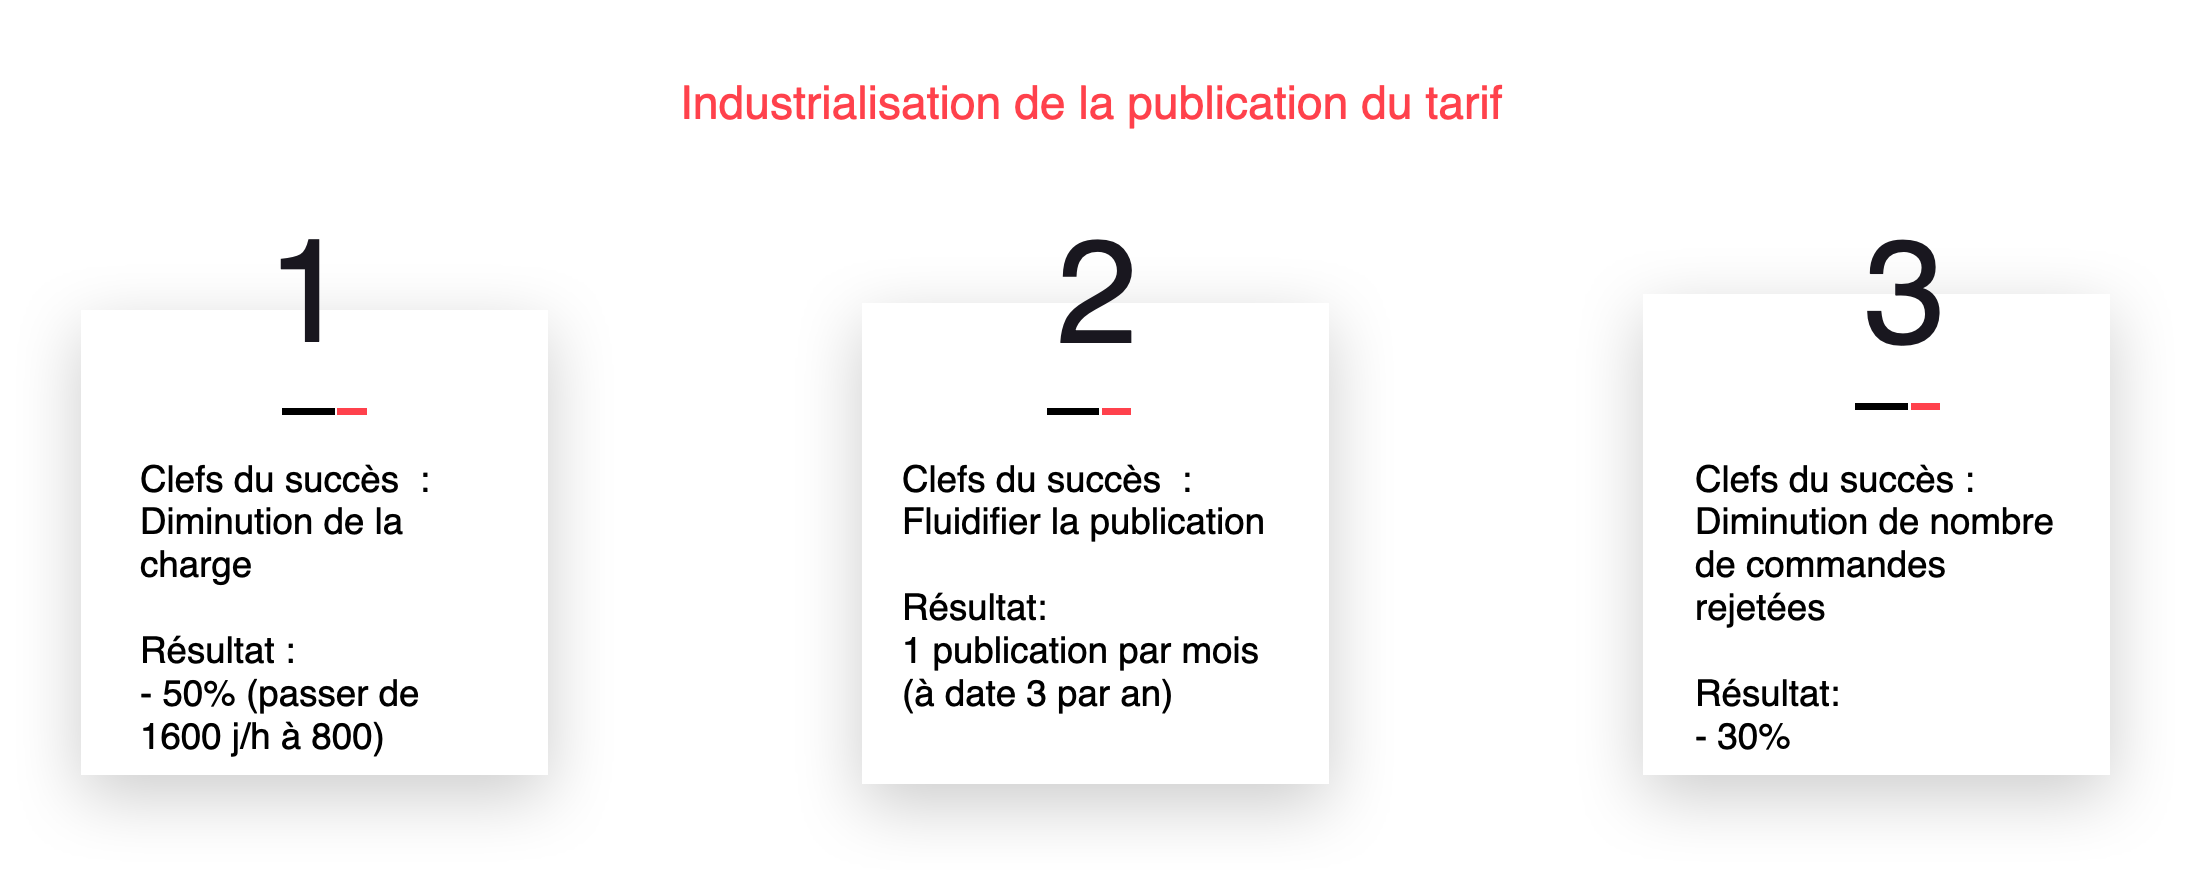
−30%
Rejected orders.
-
−50%
Publishing workload.
-
1 monthly
Release (vs 3 per year previously).
Context
At Schneider Electric, a legacy offer publication tool was powering all commercial systems: pricing, catalog, and commercial policy.
The tool:
- Had been developed in the early 2000s
- Was maintained by a single engineer
- Had no documentation or redundancy
- Was approaching end-of-life with the engineer’s retirement
We had 10 months to define the replacement strategy before operational risk became critical.
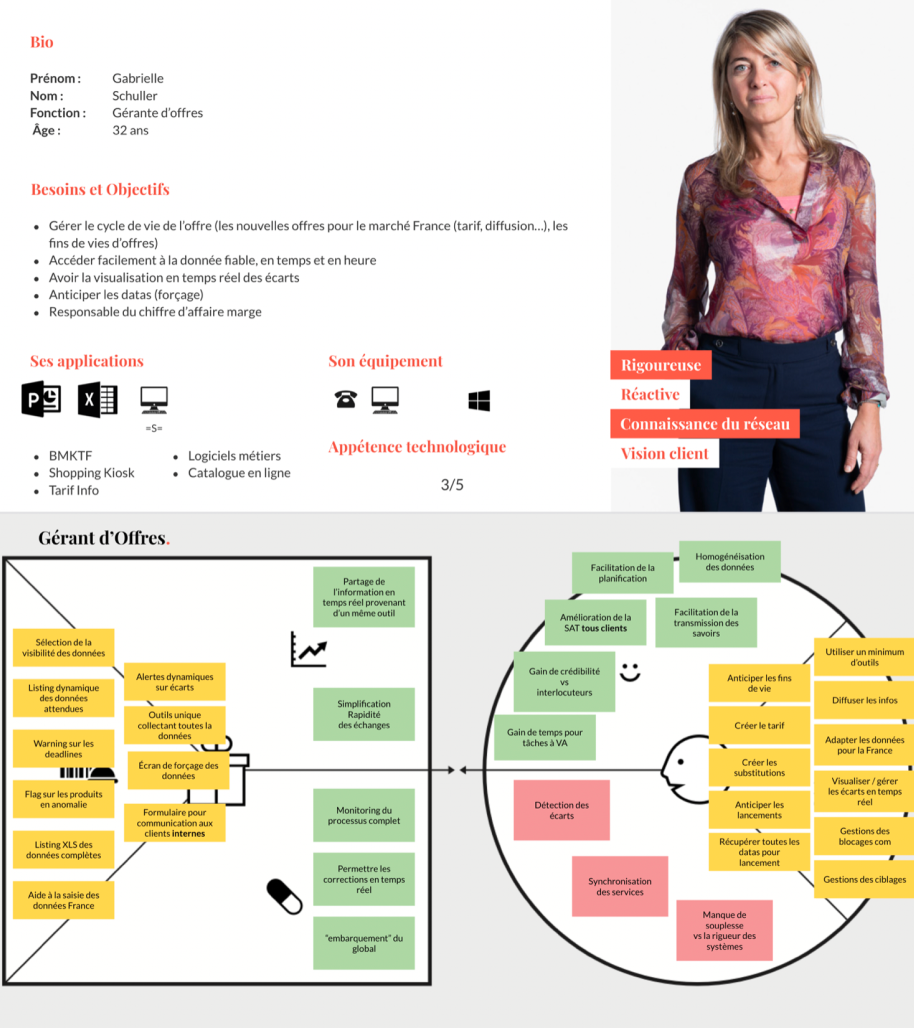
My role: define product strategy, structure discovery, and scope the MVP platform.
The Real Problem
The technical obsolescence was the trigger.
The deeper issues were operational and organizational.
Operational observations
- Sales and offer teams were spending significant time on manual publishing tasks
- Data validation was fragmented and largely manual
- New offers required several months to reach the market
- Only three releases per year were possible
Organizational observations
- Three stakeholder groups operated with independent priorities
- No shared definition of success
- No end-to-end visibility on data quality
- Strong dependency on individual expertise
This replacement was not only a technical migration, it required redefining workflows, governance, and release cadence.
Key Decisions
Reframe research around data, not users
Stakeholder conversations were structured around system architecture and data structures rather than user workflows.
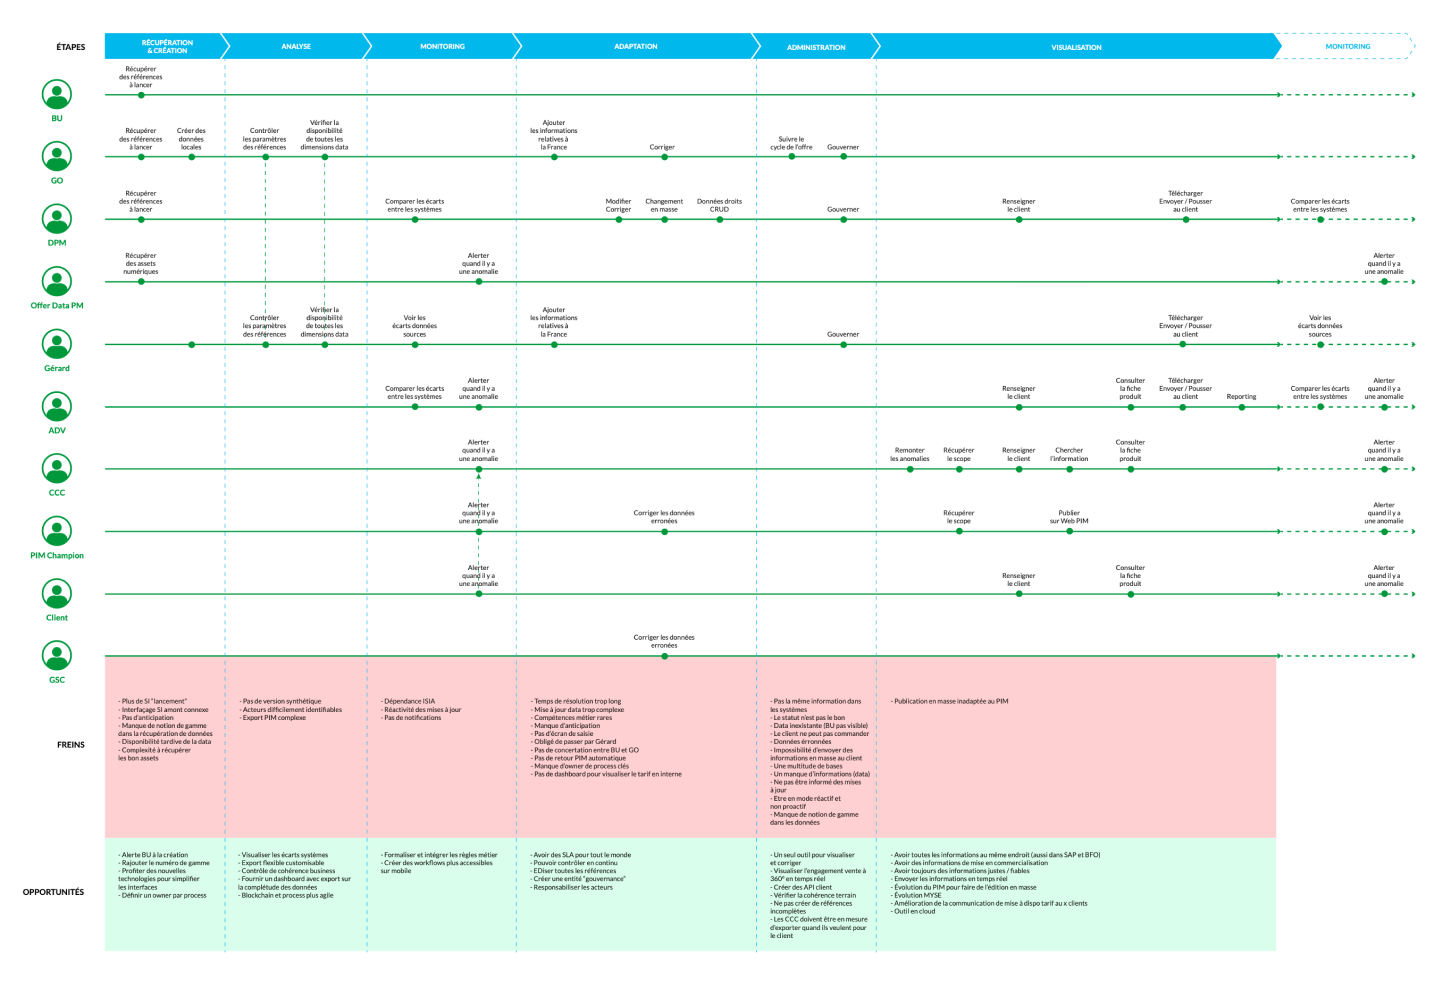
We mapped the complete data journey to:
- Created immediate alignment across technical and business stakeholders
- Surfaced bottlenecks in validation and handoffs
- Revealed ownership gaps
We then translated the data journey into user journeys.
Force stakeholder alignment with OKRs
Three stakeholder groups had competing roadmaps and release expectations.
The lead PM and I ran a structured goal-setting session: 3-month and 6-month OKRs with key results attached.
It created a shared definition of success and reduced scope drift during delivery.
Pull engineers into discovery early
We ran collaborative sketching sessions with engineers in the room as participants.
The goal was simple: catch feasibility issues before they became design debt.
This significantly de-risked implementation within the 10-month window.
Research & Discovery
Months of stakeholder interviews and team shadowing.
Four categories of risk emerged:
- Technical — obsolete stack, no maintainability
- Organizational — desynchronized teams, single point of failure
- Operational — publishing bottlenecks, manual workload
- Strategic — slow time-to-market
Across profiles and teams, three needs were consistently expressed:
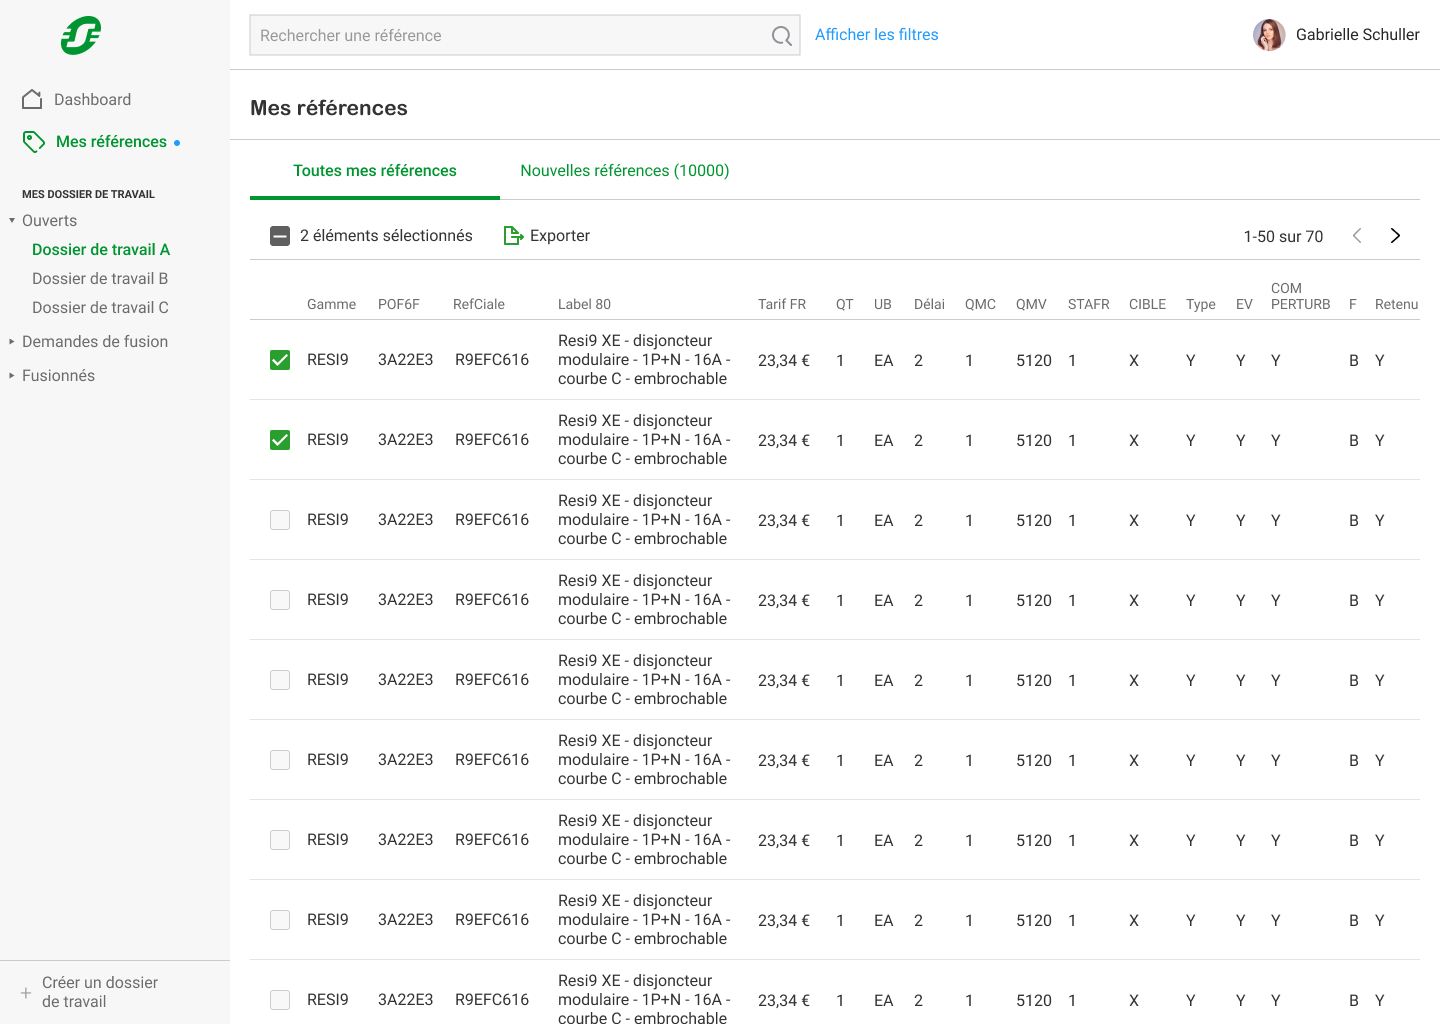
- A unified interface to view and edit data without context switching
- Integrated, continuous data quality validation within the workflow
- A reporting dashboard with exportable completeness and compliance reports
These became the backbone of the MVP scope.
Design Process
We ran feature mapping sessions with Product and Engineering.
Six MVP modules were selected:
- Administration
- Data Quality Management
- Offer Management
- Pricing Edition
- Reporting
- Governance & permissions
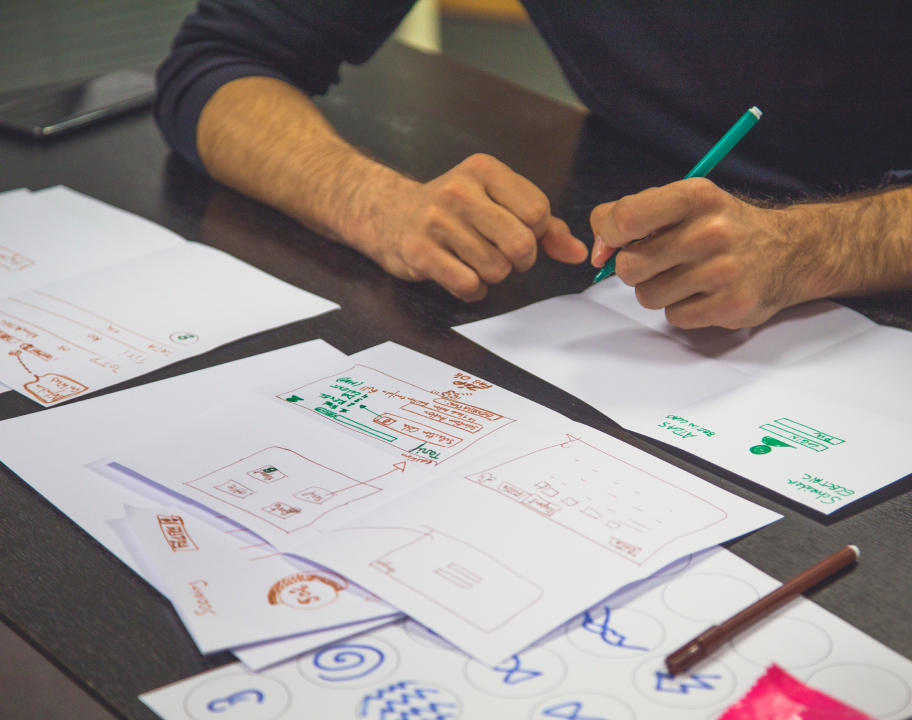
To structure ideation, I facilitated a sketching session supported by a curated UX inspiration wall, making solution exploration accessible to non-design stakeholders.
Outcomes & Learnings
-
−30%
Rejected orders.
-
−50%
Publishing workload.
-
1 monthly
Release (vs 3 per year previously).
Key learnings from this transformation:
-
Adapting research framing accelerates alignment
Structuring discovery around stakeholder mental models (data lifecycle) enabled faster buy-in and reduced resistance to change.
User journeys were introduced once alignment was established, increasing their adoption. -
Early engineering involvement reduces delivery risk
In constrained environments, involving engineers in discovery is a risk mitigation strategy.
It improves feasibility validation and shared accountability.